Monthly housing starts by metro, counted from the ground up.

New foundations and framed structures per metro and submarket, from repeat high-res satellite passes, for the desk that models housing supply.

Spec sheet

GSD
0.5 m or finer (VHR)
Cadence
monthly
Platform
high-res satellite
Spectral
RGB
Unit of delivery
metro and submarket
Files
CSV and map layer
Access
pilot, forward from onboarding
01

The files

The pilot delivers on a monthly schedule for the metros and submarkets agreed at onboarding.

F-01Metro starts count

Format
CSV
What's in it
One row per metro or submarket per month. Counts of new foundations and framed structures, split by stage, with the vintage of the imagery each month's count comes from. Plain CSV, so it opens in Python, R or Excel.
Cadence
Monthly

F-02Site map layer

Format
Map layer
What's in it
Every detected site as a point or footprint, tagged foundation or framed, for the same month. Opens in QGIS, ArcGIS or your own mapping tool, so you can inspect what sits behind a count before it goes in the model.
Cadence
Monthly

F-03Month-over-month change

Format
CSV + map layer
What's in it
Sites that appear as new against the prior pass, and sites that moved from foundation to framed. Use it to see a spike or a slowdown in a metro without differencing two counts by hand.
Cadence
Monthly
02

How it works

  1. 01 · your side

    You send the AOI

    The metro or submarket boundaries you model, as a shapefile or GeoPackage, or the metro names if you use standard definitions.

  2. 02 · our side

    We schedule the passes

    High-res satellite passes over your AOI on a monthly rhythm. The pilot builds forward from onboarding.

  3. 03 · our side

    Change detection

    New foundations and framing are flagged against the prior pass and tagged by stage.

  4. 04 · your side

    Delivery

    The metro count and the map layer arrive each month in your pilot workspace, with the vintage of the imagery stated.

03

Limits

Cloud and haze

Effect
Optical imagery. Persistent cloud over a metro can push that month's read to the next usable pass.
Detail
The delivery states the vintage, so a late read is visible and not passed off as current.

Snow cover

Effect
Snow on the ground can hide a poured slab.
Detail
Northern metros will show gaps or late reads in winter months.

0.5 m is the floor

Effect
A single home foundation is well inside what resolves.
Detail
Interior work, renovations, and small additions do not show, and a small outbuilding can be hard to tell from a house.

Structures, not units

Effect
The count is of structures.
Detail
A multifamily building appears as one structure, and the number of apartments in it is not read from the imagery.

Monthly, not live

Effect
Cadence is a target.
Detail
The series is not daily or weekly and should not be read as a live feed.

No backfill

Effect
The pilot builds forward from onboarding.
Detail
It does not include a history to back-test against.

Pilot metros only

Effect
Coverage is the metros agreed for the pilot, not national.
04

Why this exists

Your starts model runs on the official release, permit filings and, if the shop pays for one, a builder tracker somebody keeps by hand. The official series gets revised after it prints. Permits tell you what was authorized, not what got poured.

So before a homebuilder reports or your supply forecast goes out, you hold a number for a metro that you already expect to move, and nothing independent to check it against. This is a second read taken from imagery, on a fixed monthly schedule, that sits beside those sources.
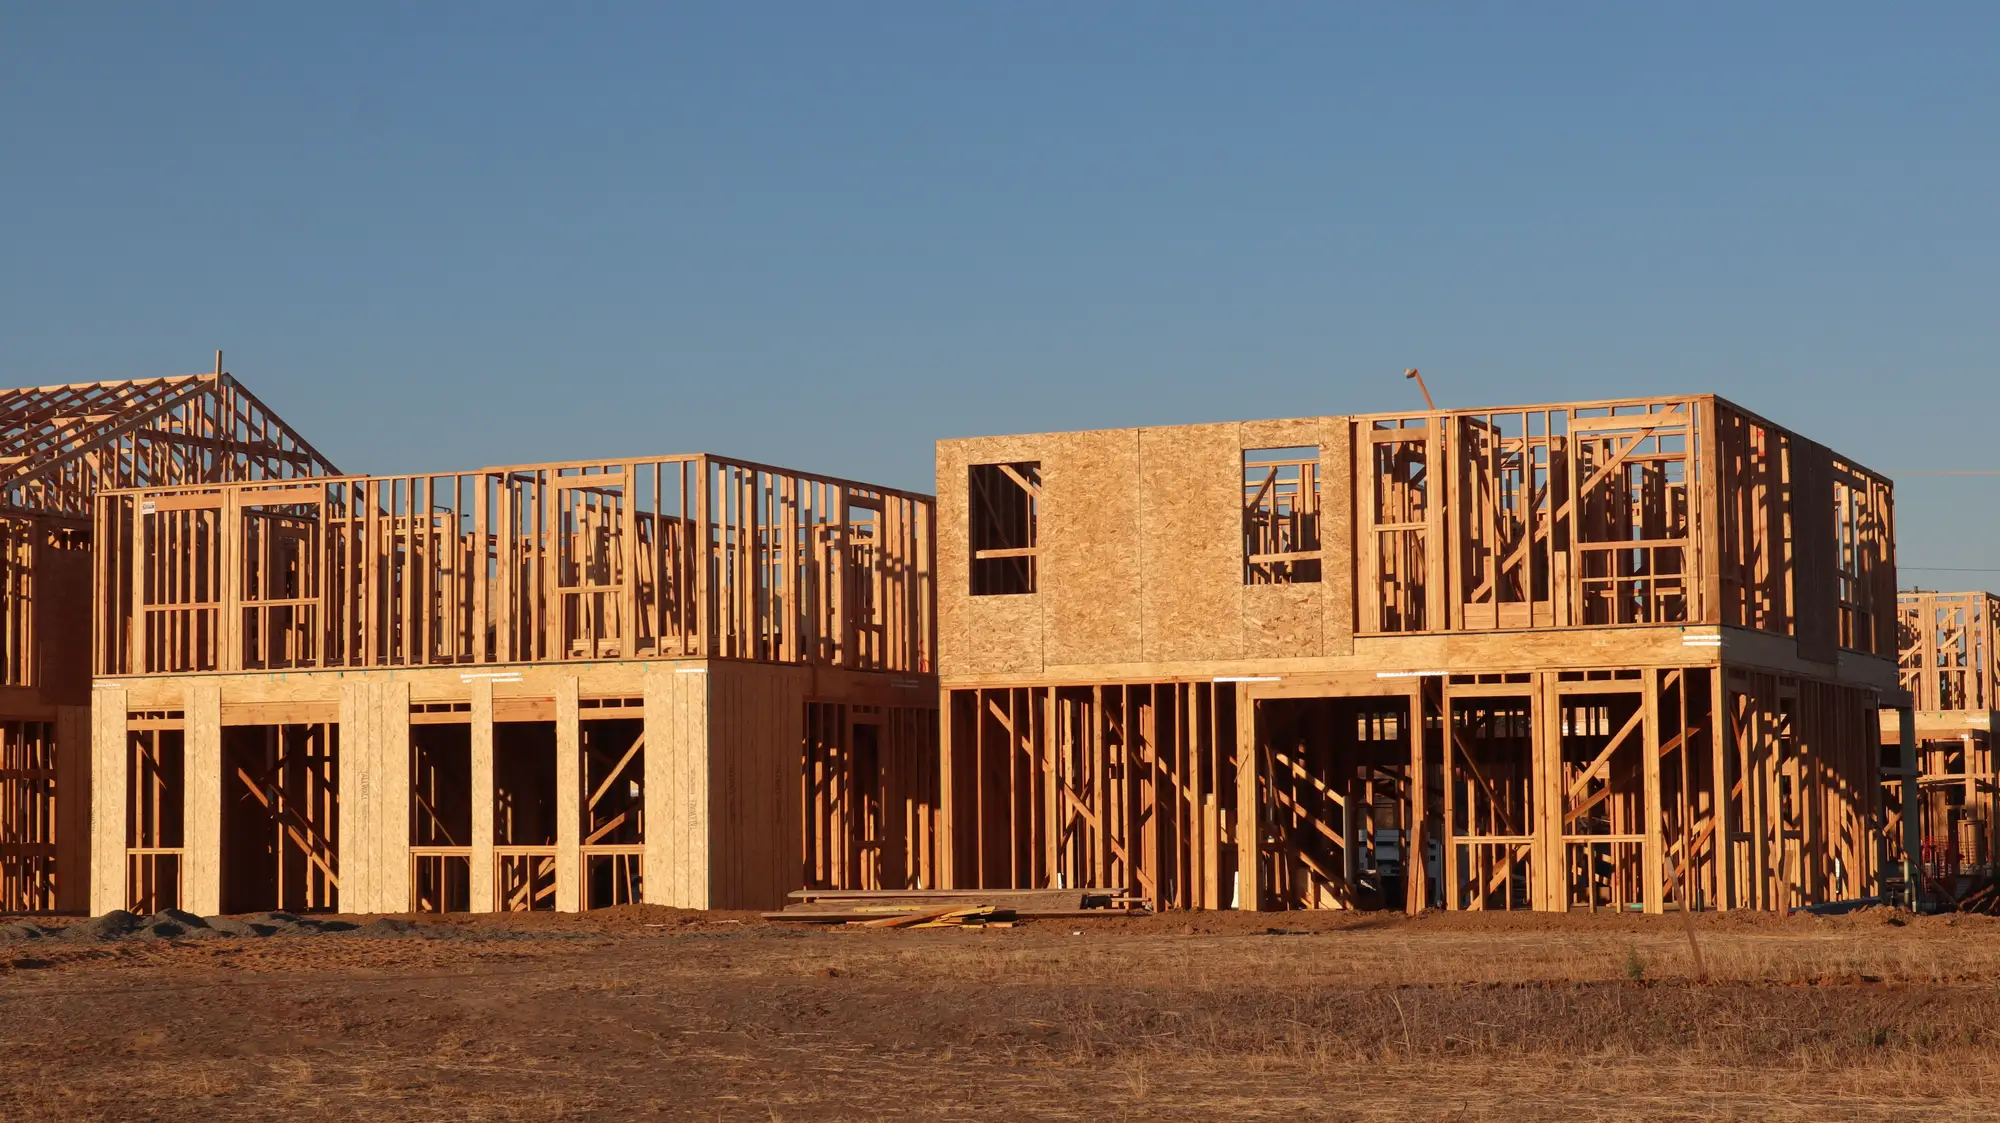
Timber frames of new two-storey homes on a bare lot in late sun
Scenery: framing on a new subdivision, seen from the street.
05

Who it's for

For

  • Housing and real-assets analysts at REITs and macro funds who keep a starts model by metro.
  • Data and quant analysts who evaluate alternative series and want to see the file layout first.
  • Desks that want an independent read next to permits and builder surveys ahead of earnings or a supply forecast.

Not for

  • Teams that need a national series or a metro that hasn't been agreed for the pilot.
  • Teams that need a history to back-test on day one.
  • Unit counts, pricing, or a forecast of absorption. The imagery reads structures, not apartments or sales.
  • A replacement for the official starts or permit series.
06

Questions from the evaluation desk

Does cloud cover delay a month's count?

Yes. Persistent cloud over a metro can push that month's read to the following pass, and the file says which imagery date it came from.

What is the smallest structure you can flag?

Individual home foundations and framed structures at 0.5 m or finer. Renovations and interior work don't show.

Is this a substitute for permit data?

No. It is an independent check that runs alongside the official series. We don't claim it reconciles with Census or permit releases.

Can you cover any metro?

The pilot starts with metros we agree on together. It is not national coverage.

How far back does history go?

The pilot builds forward from onboarding. There is no historical backfill.

How do we check it against our own data?

Every site sits in the map layer with its stage and imagery date, so you can compare a metro against your own tracker, permit records or site visits. Tell us where your ground truth is when the AOI is scoped.

What formats do the files come in?

A CSV for the count and a map layer for the sites. If you need a specific layer format for your stack, say so at scoping.

Who owns the data we receive?

Use terms for the delivered files are written into the pilot agreement before it starts. The satellite archives the imagery comes from keep their own licences.

How is the pilot priced?

Each pilot is scoped on the number of metros and submarkets and how long it runs. You get a written scope you can take through your own approval process.

Send us the metros you model and we'll scope a pilot.

Or .

Start a pilot